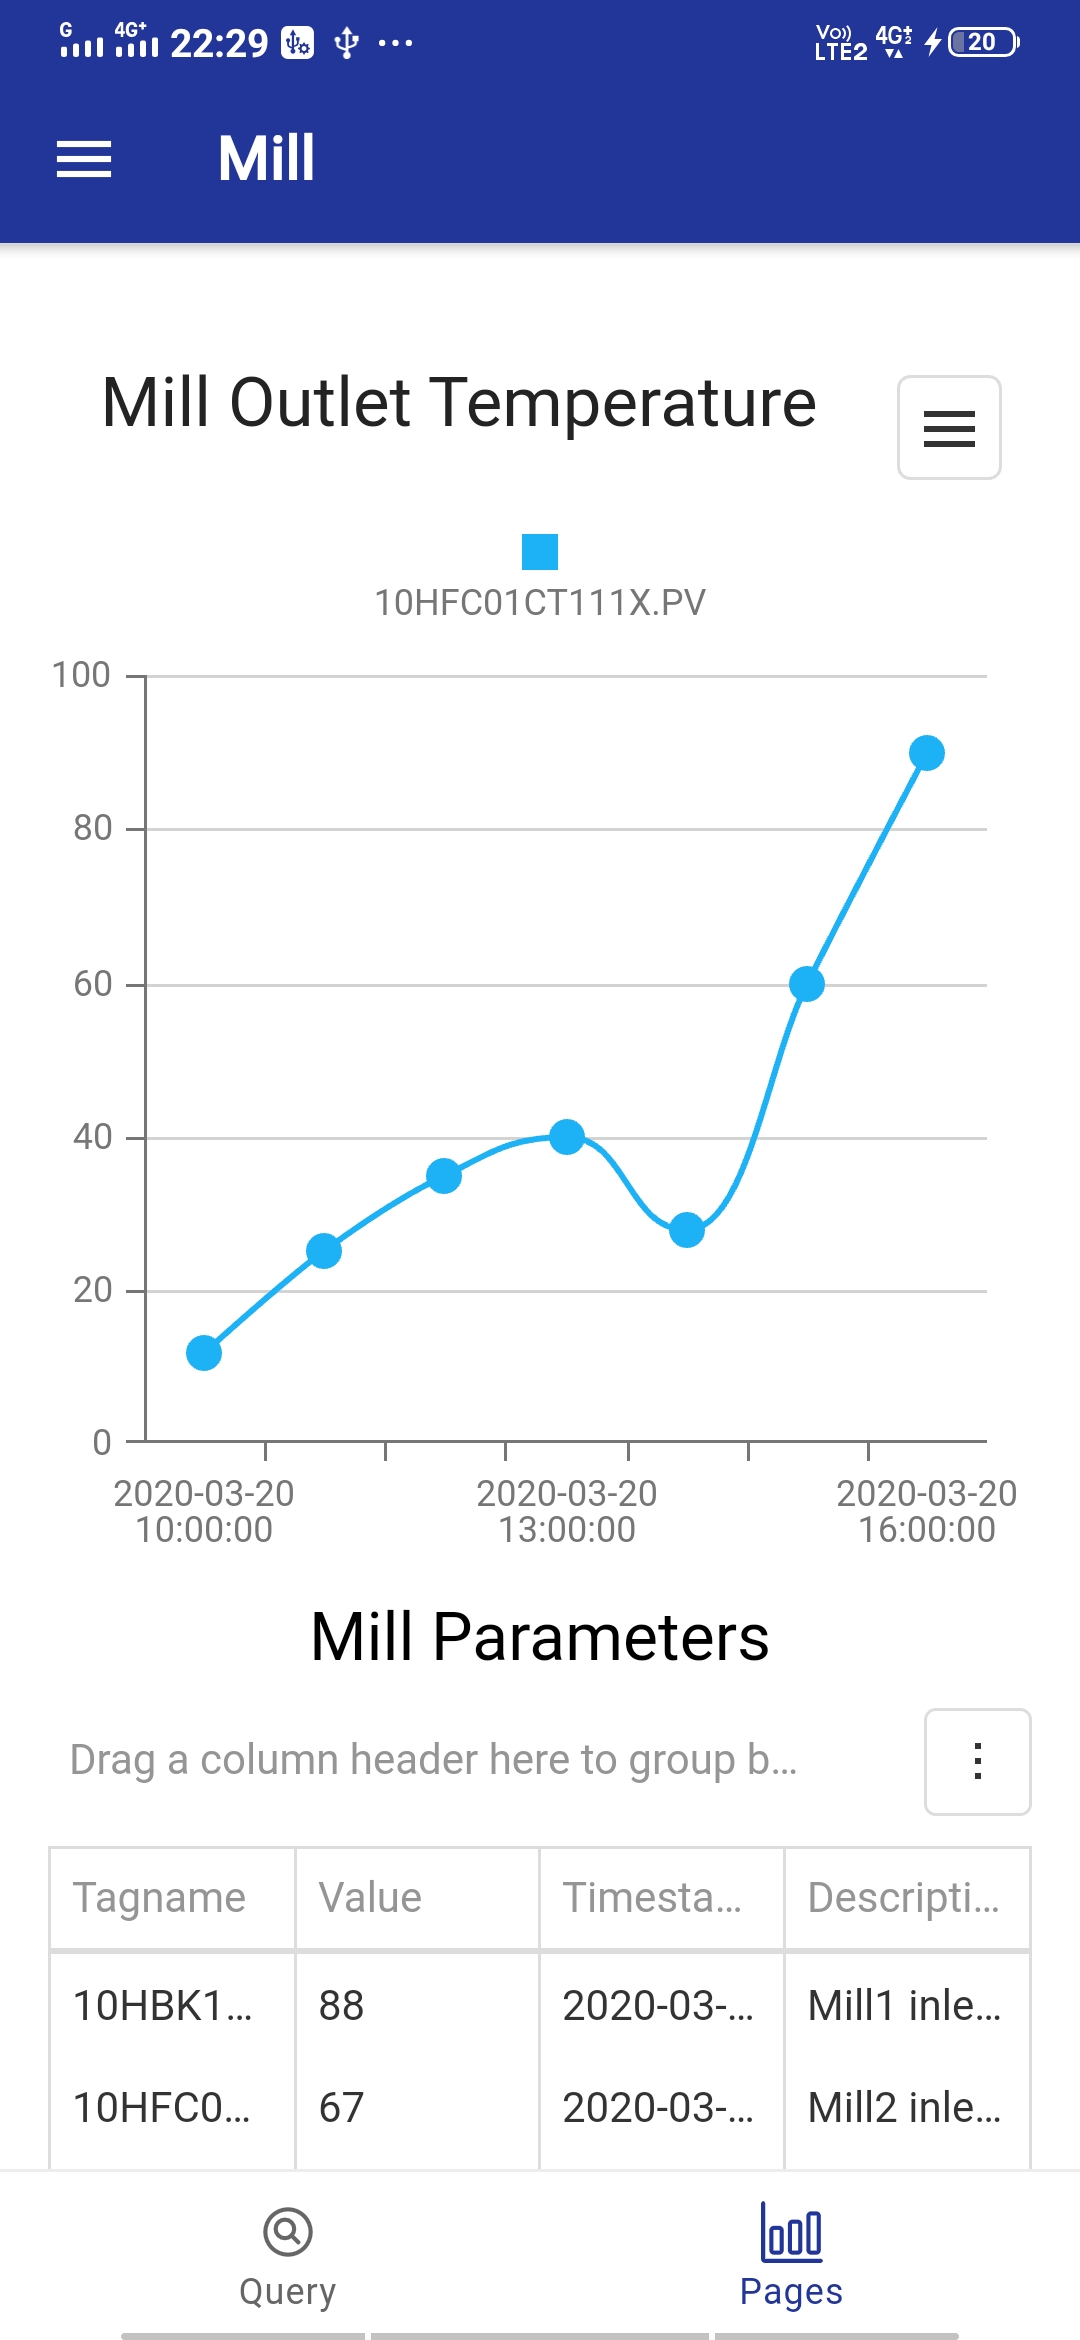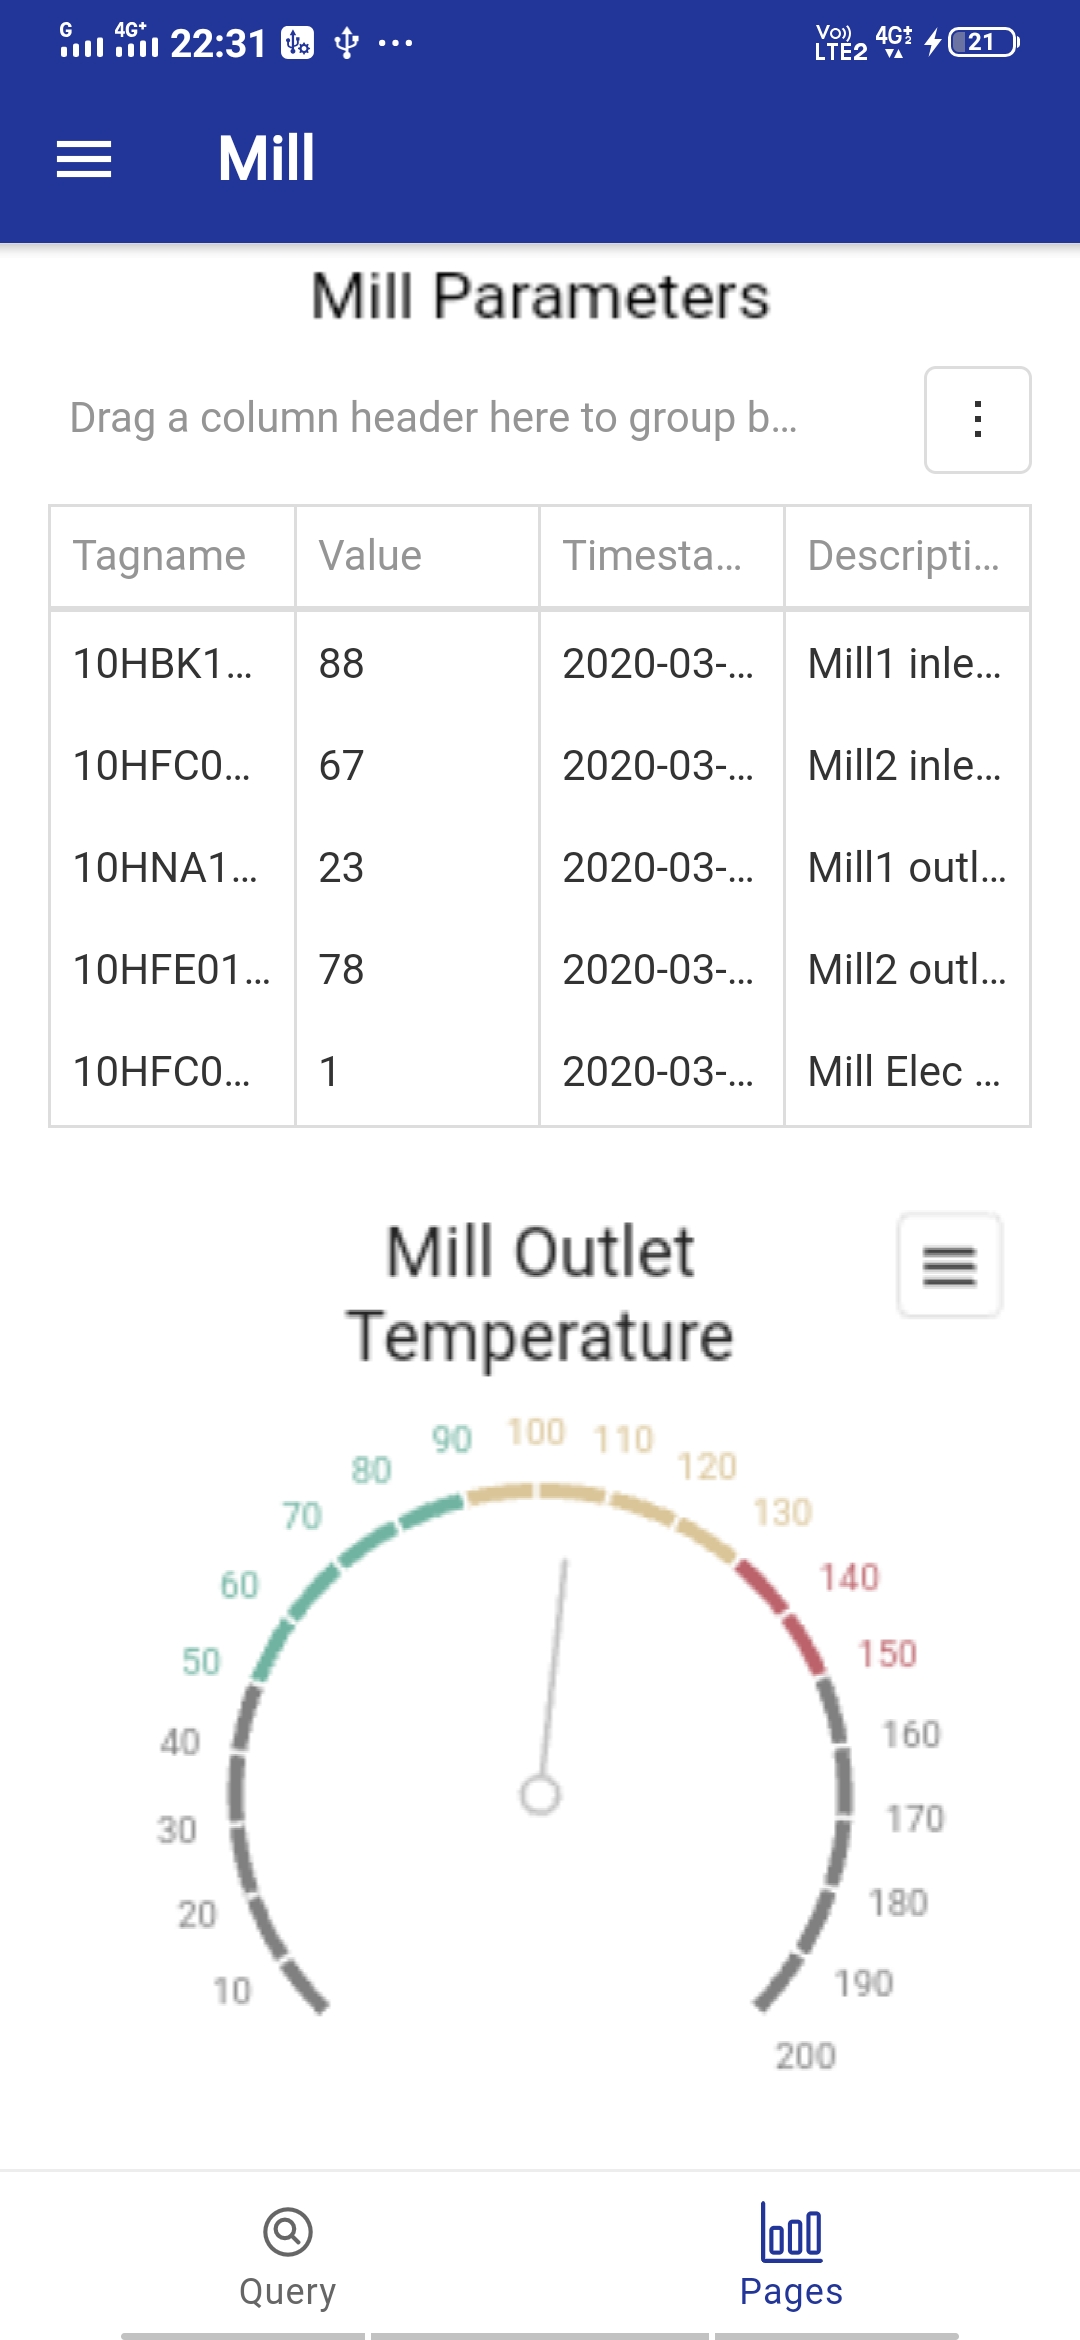
SAMA RT Web Visualization for displaying Historian data, trends & various KPI’s like pie chart, bar graph, etc., through web. These options are user- defined i.e. can be configured unique for each user and multiple pages can be defined for a single user. Watch your production and performance live, wherever you are.